Performance Profiling
The goal of this guide is to enable the reader to understand the performance of Scanner graph execution and how performance can be improved by tuning execution parameters.
Overview
While executing a graph, Scanner keeps a record of how long various tasks take to complete: loading data, moving data between CPU and GPU, executing operations, saving data, etc. We call this information the profile of a computation graph. Getting the profile for the execution of the computation graph works as follows:
import scannerpy as sp
import scannertools.imgproc

# Set up the client
sc = sp.Client()

# Define a computation graph
video_stream = sp.NamedVideoStream(sc, 'example', path='example.mp4')
input_frames = sc.io.Input([video_stream])
resized_frames = sc.ops.Resize(frame=input_frames, width=[640], height=[480])
output_stream = sp.NamedVideoStream(sc, 'example-output')
output = sc.io.Output(resized_frames, [output_stream])

# Run the computation graph
job_id = sc.run(output, sp.PerfParams.estimate())

# Get the profile
profile = sc.get_profile(job_id)
The Profile class contains information about how long the various parts of the execution graph took and on what processors or workers (when running Scanner with multiple machines) those parts were executed. We can visualize the profile on a timeline by writing out a trace file:
profile.write_trace(path='resize-graph.trace')
You can view this file by going to chrome://tracing in the Chrome browser, clicking “load” in the top left, and selecting resize-graph.trace.
Trace Visualization
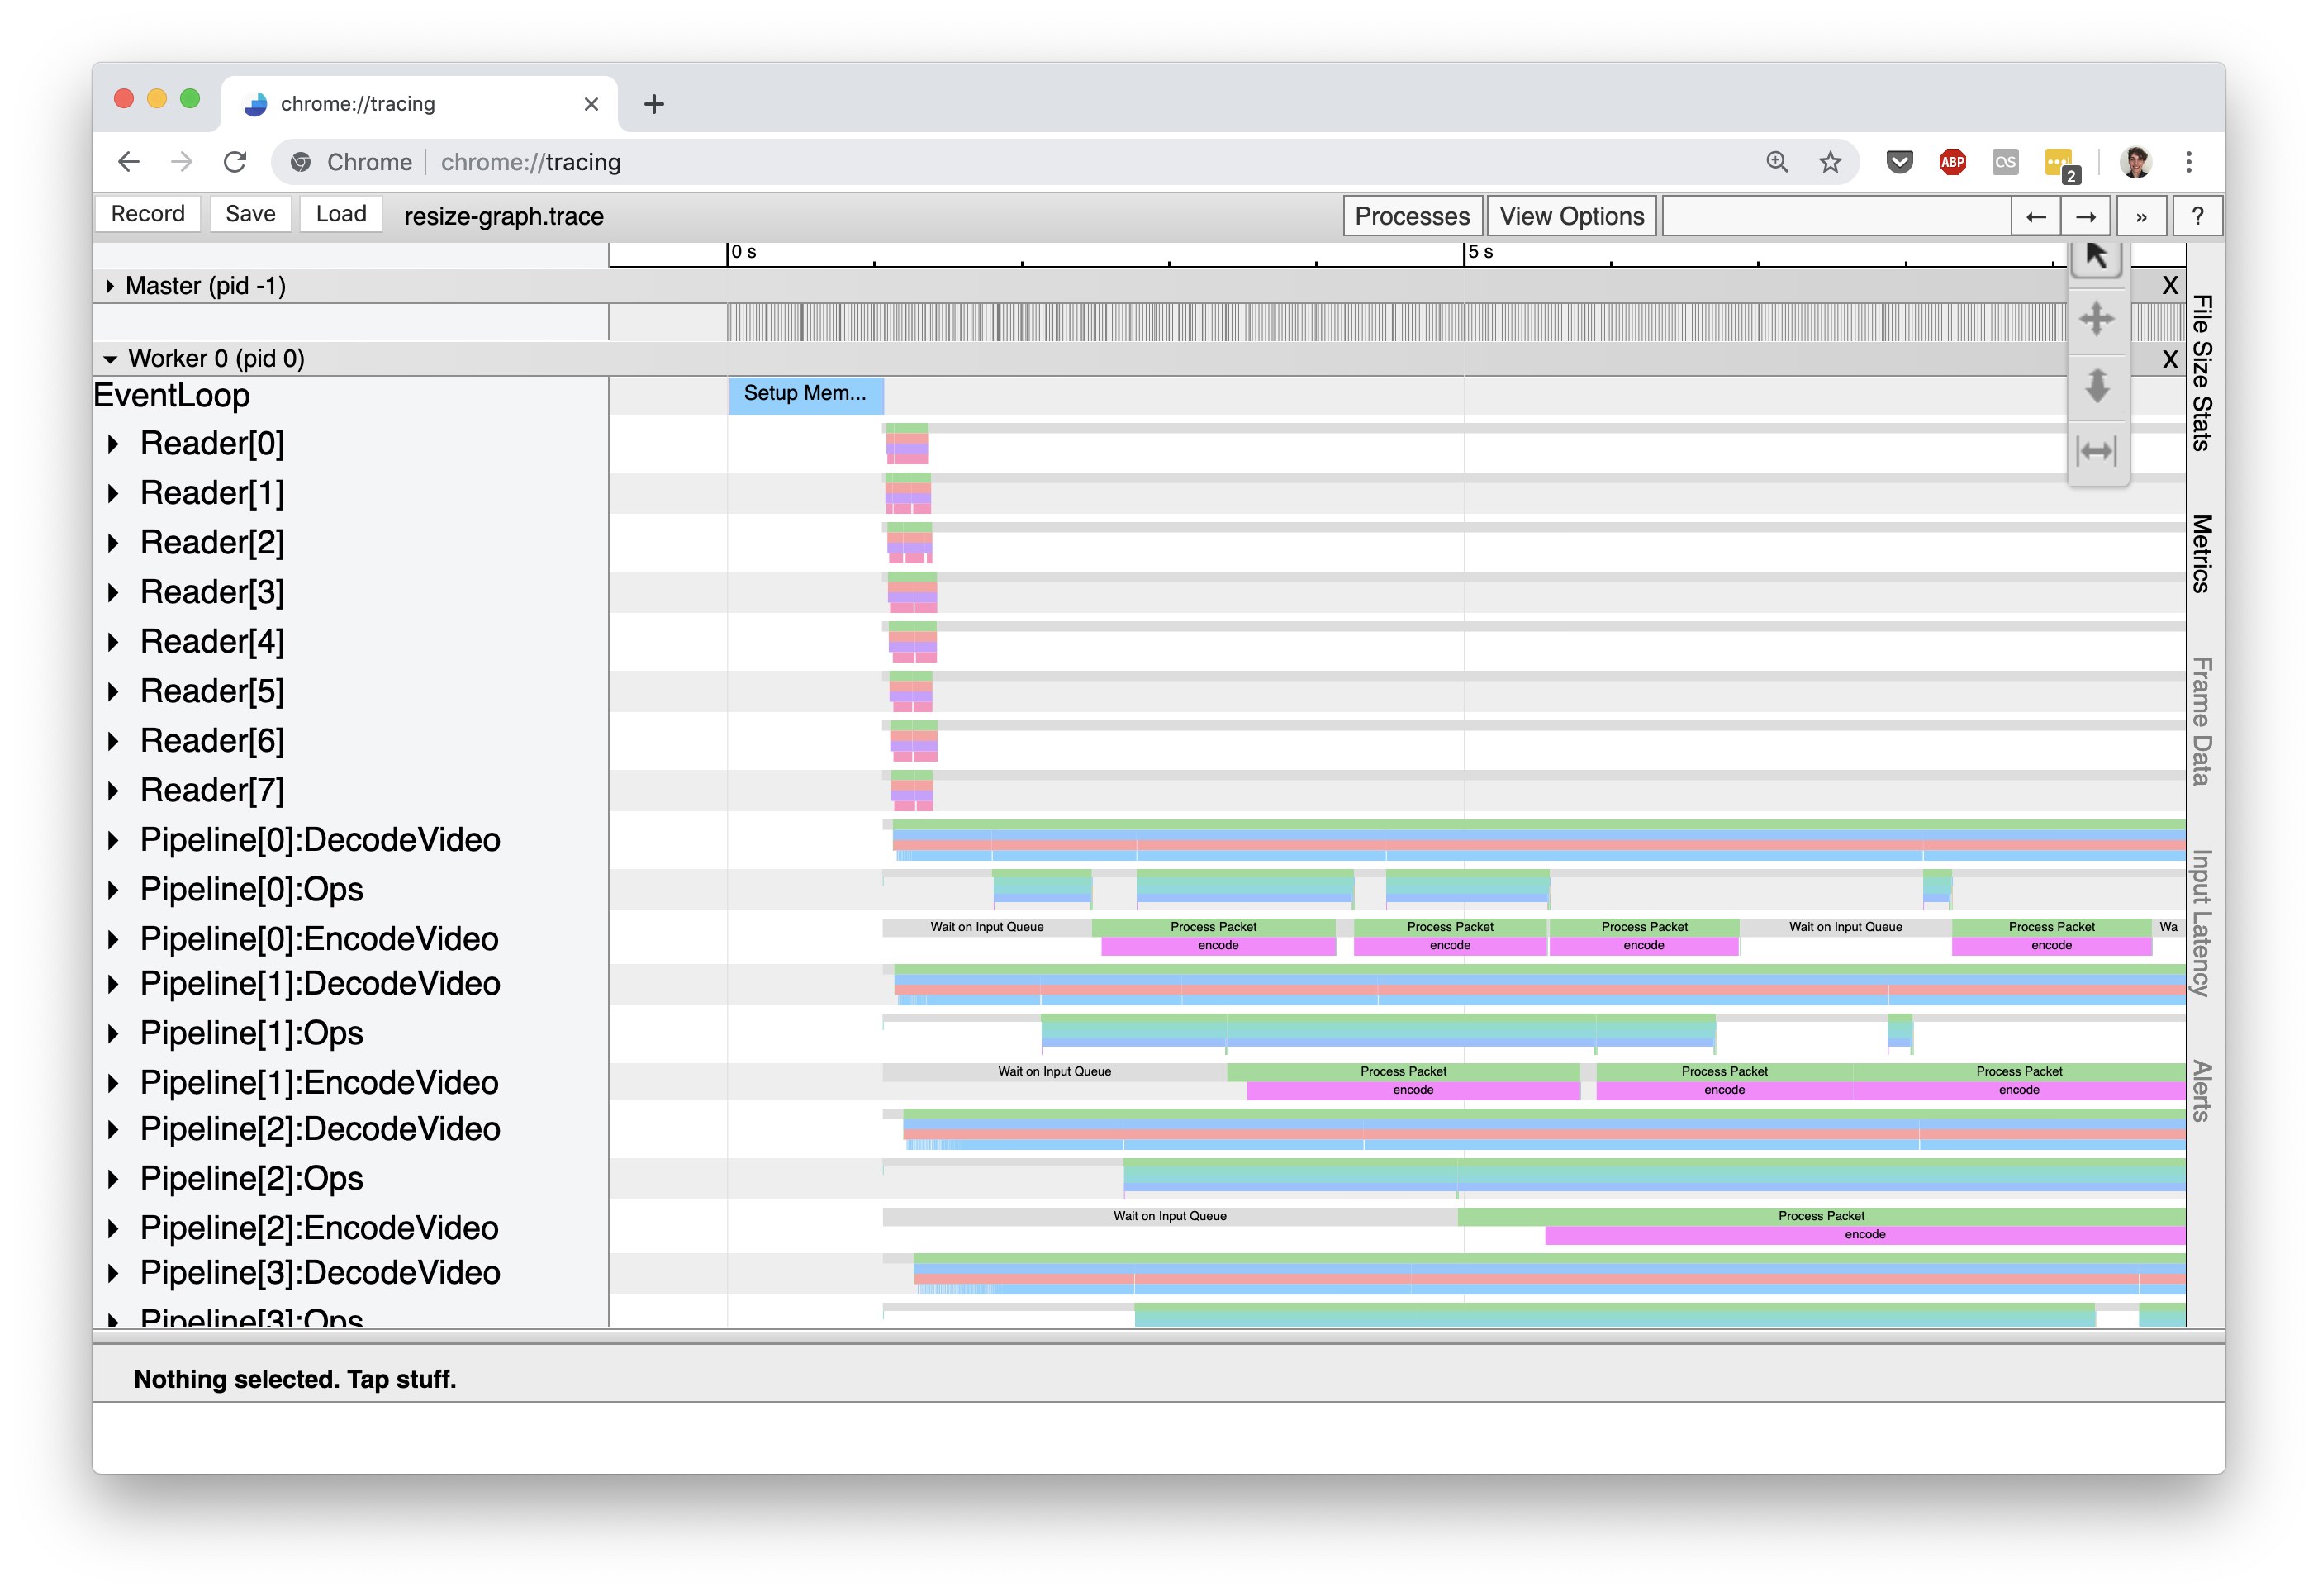
Scanner leverages the Chrome browser’s trace profiler tool to visualize the execution of a computation graph. Below is a screenshot from viewing the trace file generated with the above code:

Let’s walkthrough how Scanner’s execution of a graph is visualized in this interface. But first, we need to explain how Scanner actually executes a graphs.
Scanner’s Execution Model
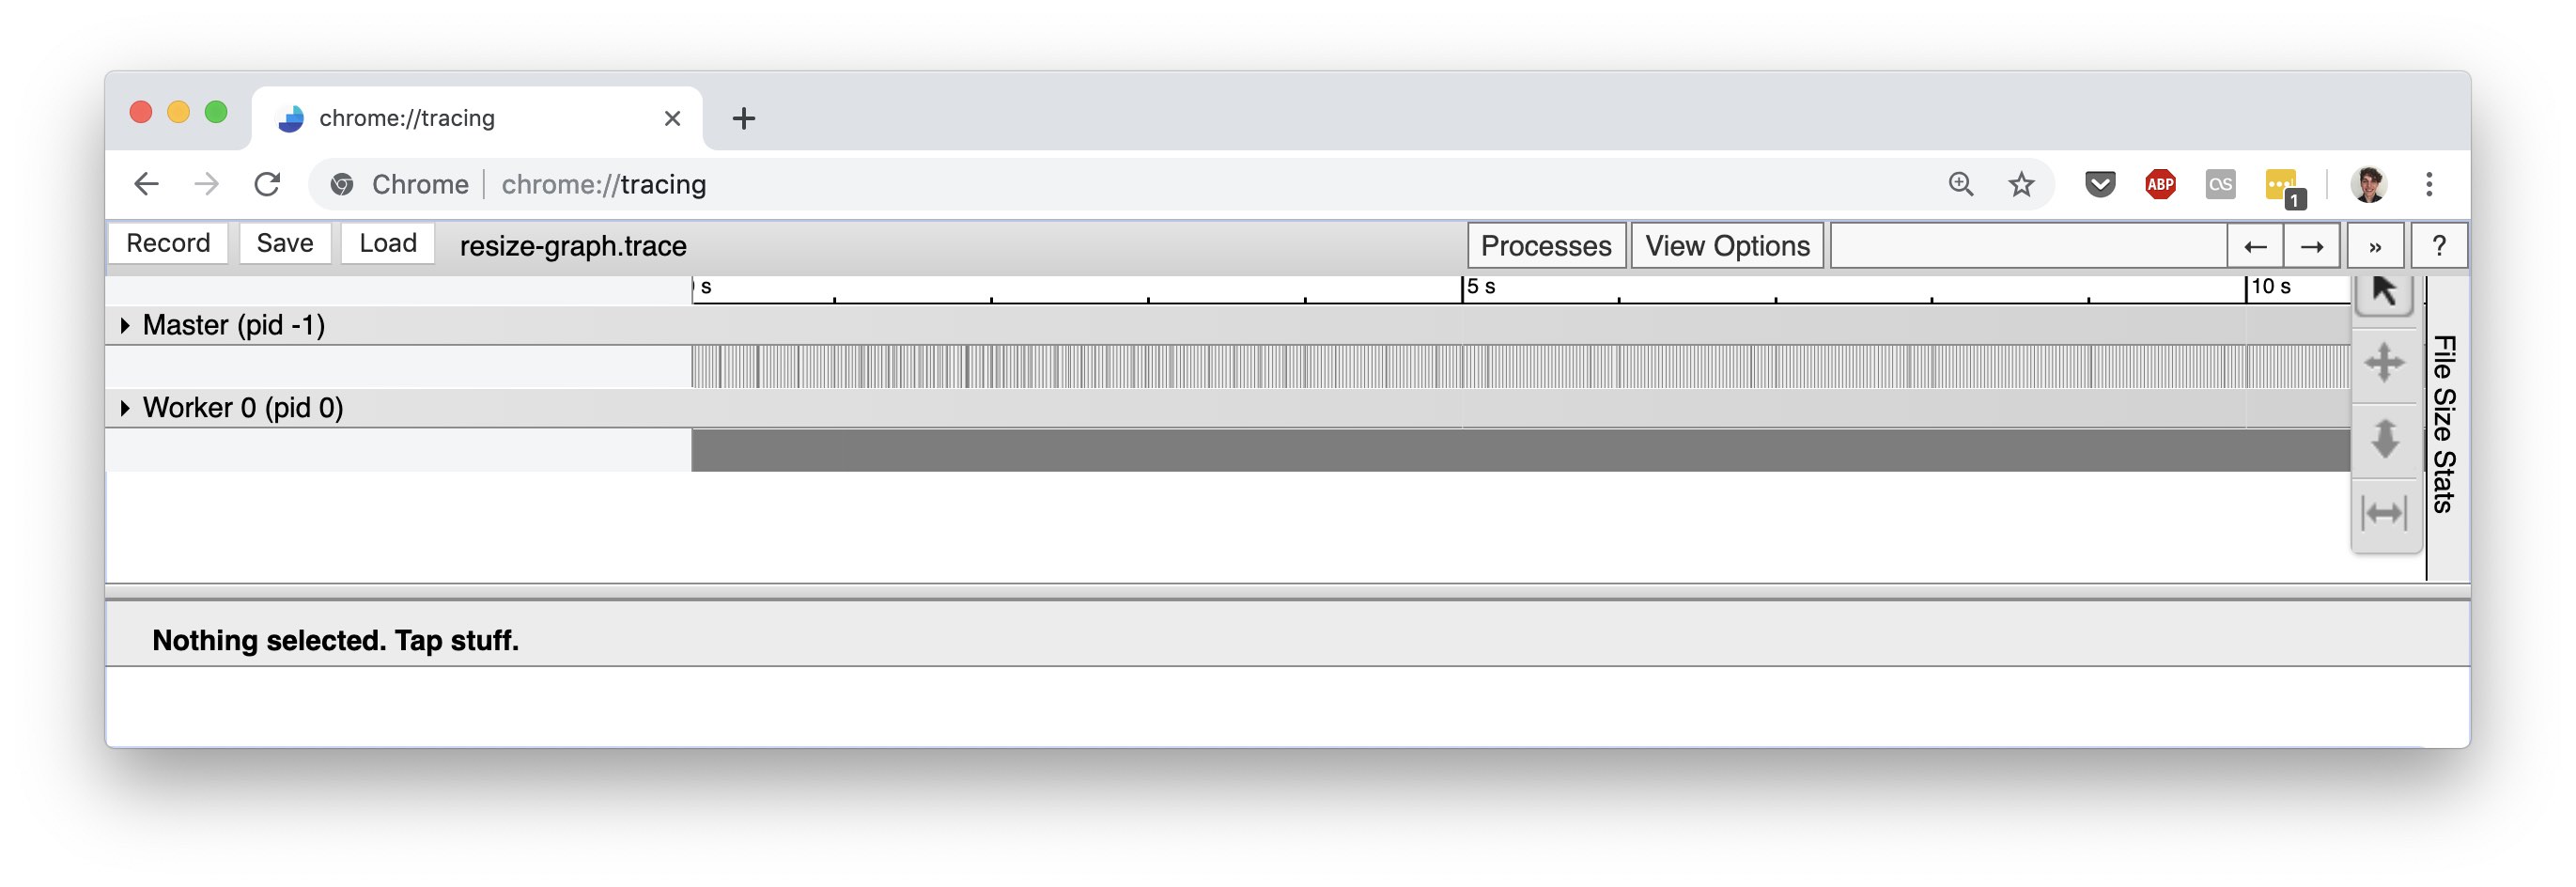
Scanner operates under a master-worker model: a centralized coordinator process (the master) listens for commands from a client (scannerpy.client.Client) and issues processing tasks to worker processes that are running on potentially hundreds of machines (the workers). Naturally, the trace visualization groups together processing events by the process they occur in:

Here, you can see the master process and a sole worker (there is only one worker for this trace because we ran Scanner locally only on a single machine). The events for the master process mainly deal with distributing work among the workers and tracking job progress. Since these events are usually not performance critical, we won’t go into them here. On the other hand, the recorded events for a worker process reflect the execution of the computation graph that was submitted to Scanner and so are useful for understanding the performance of a Scanner graph. Let’s look at the worker process’ timeline of events:

Within a single worker process, Scanner implements a replicated pipeline execution model to achieve parallelism across CPUs and GPUs. At a high level, pipeline execution breaks up the computation graph into distinct pipeline stages, which are each responsible for executing a subset of the graph, and these stages are hooked together using queues. For example, in the above trace screenshot the rows correspond to distinct pipeline stages: Reader[X], Pipeline[X]:DecodeVideo, Pipeline[X]:Ops[Y], etc. Each row contains the trace events for the labeled pipeline stage. The number inside the square brackets, [X], represents a replica of that pipeline stage. Each replica of a pipeline stage can process data in the graph independently, and thus the number of replicas controls the amount of parallelism for a pipeline stage.
Here’s a list of all the pipeline stages in a Scanner graph that will show up in the profile event trace:
Reader[X]: responsible for reading data from the input stored streams to the graph.Pipeline[X]:DecodeVideo: responsible for decoding compressed video streams from readers.Pipeline[X]:Ops[Y]: handles executing a portion of the computation graph. If a computation graph has operations that use different devices (CPU or GPU), then Scanner will group operations together based on device type and place them in a separate pipeline stage. These separate stages are indicated by theYindex inOps[Y].Pipeline[X]:EncodeVideo: responsible for compressing streams of video frames destined for an output operation.Writer[X]: responsible for writing data from the outputs of the graph to the output stored streams.
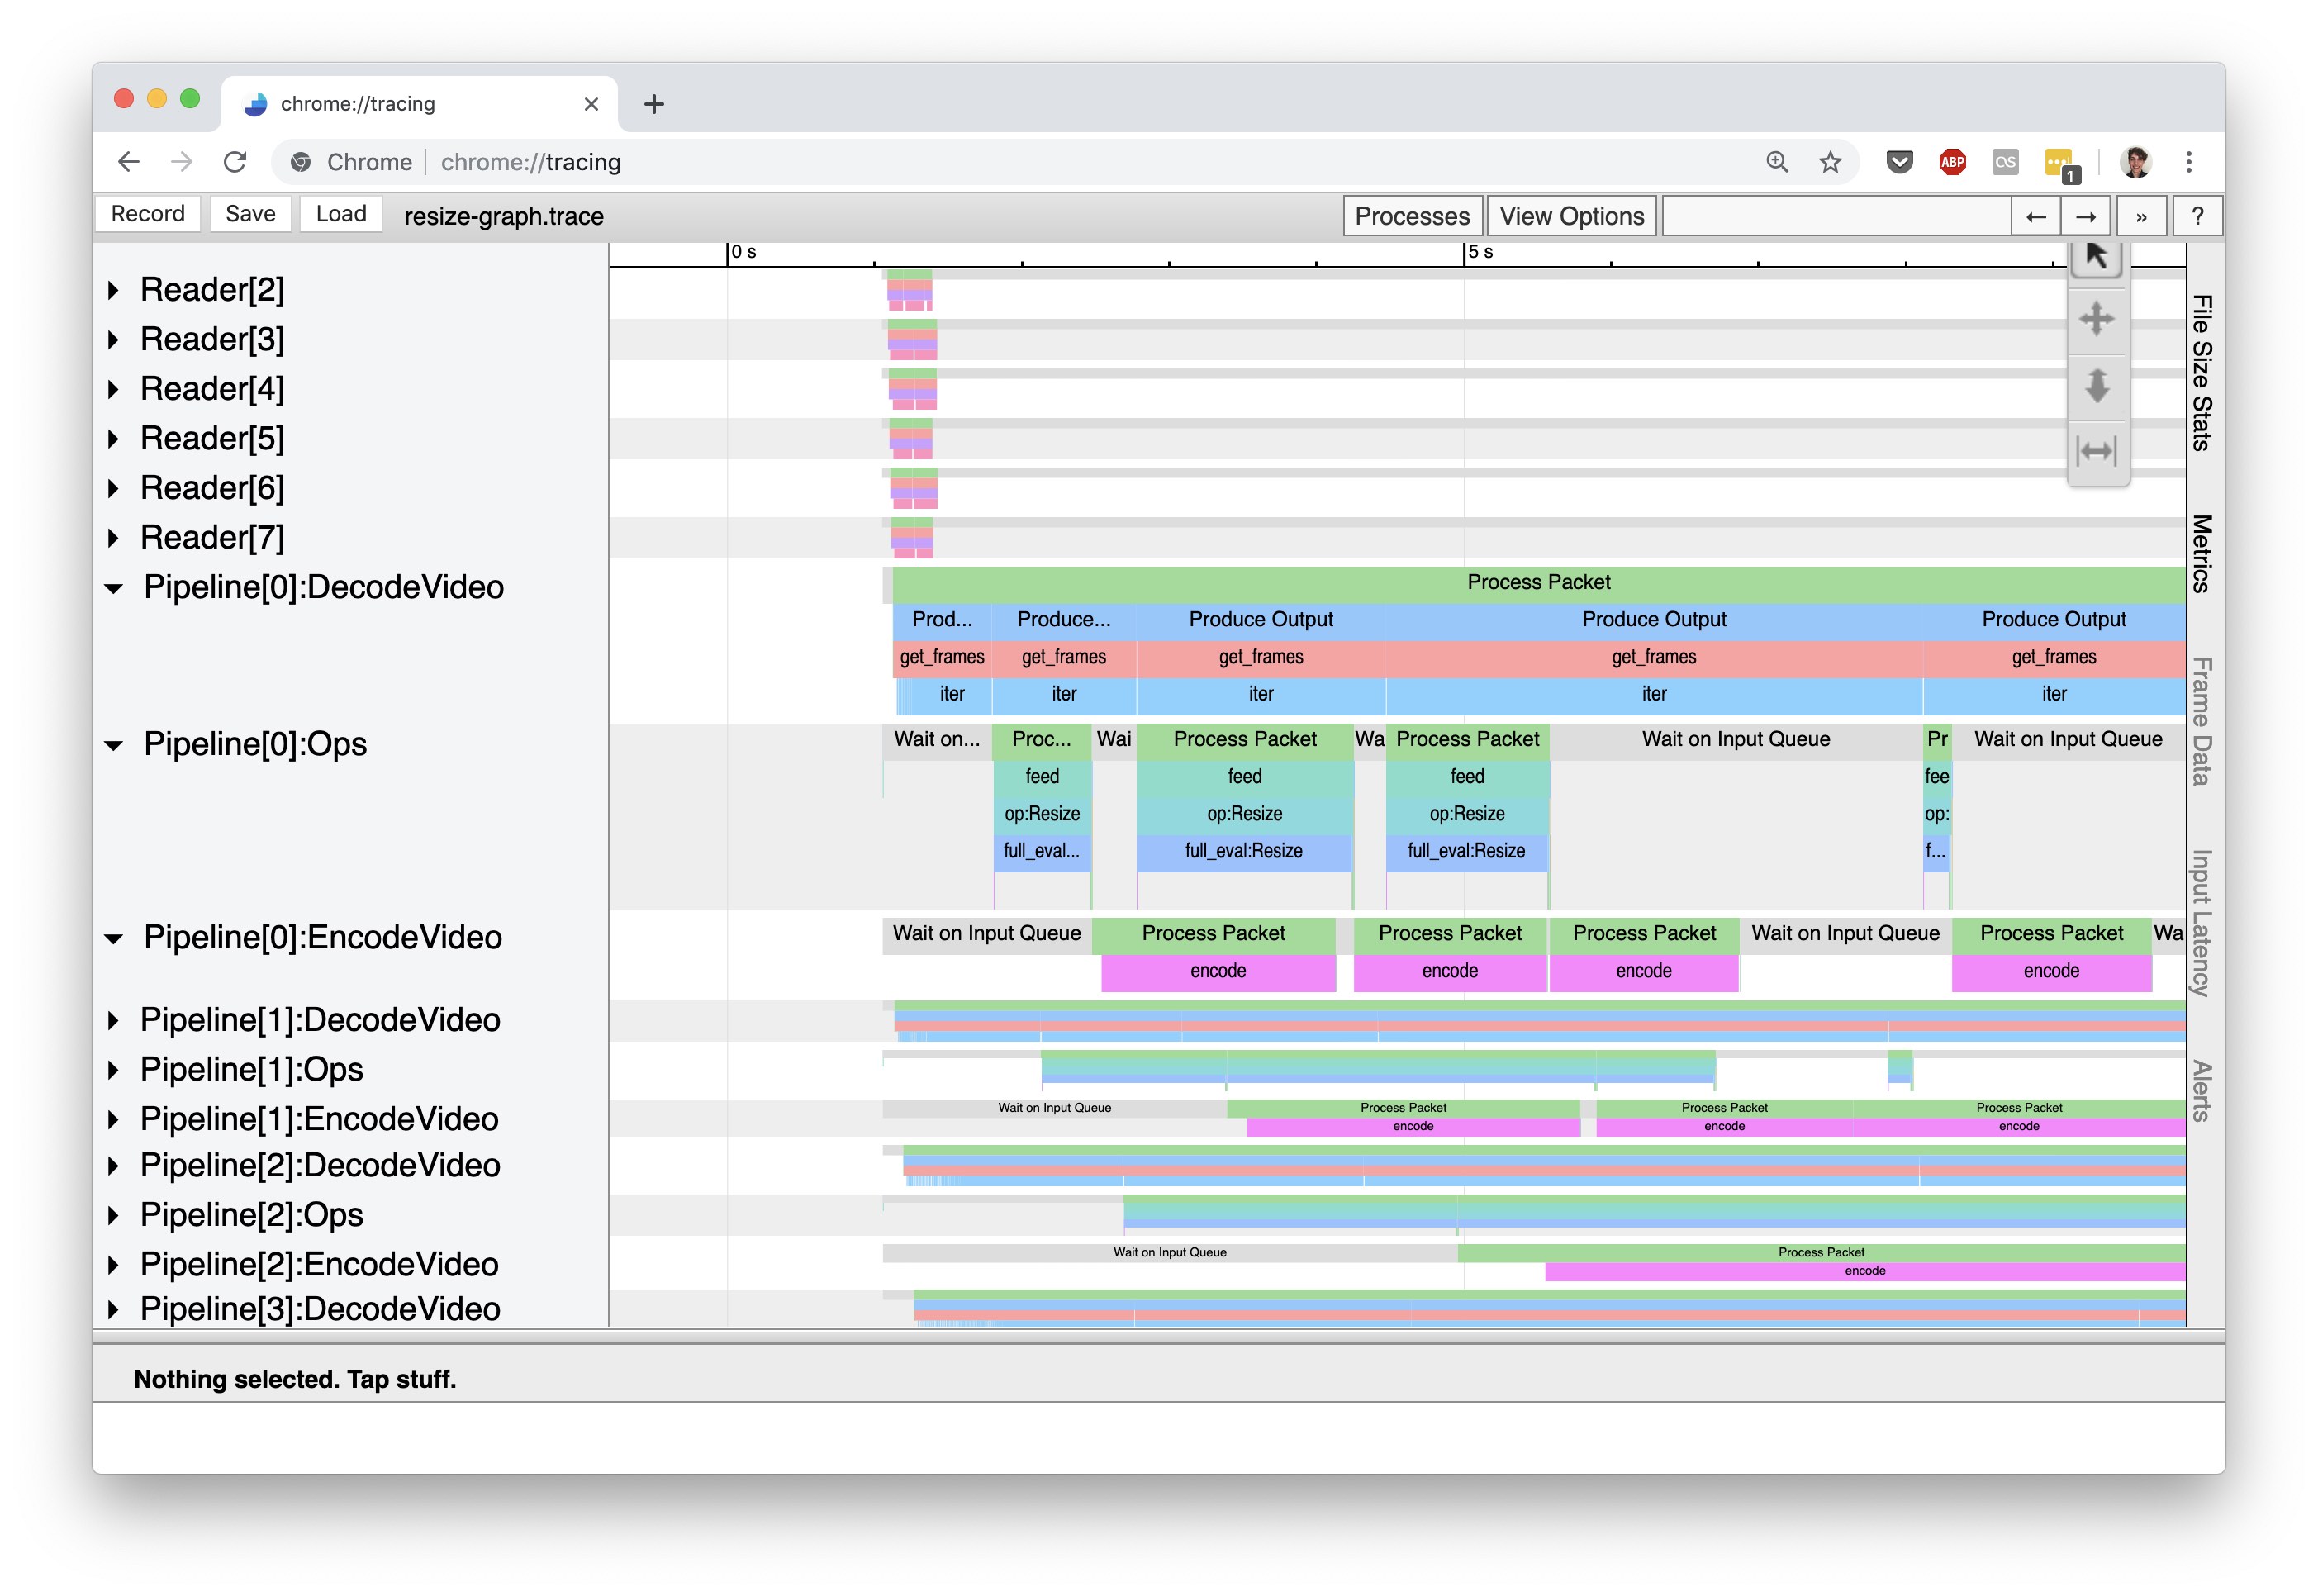
Let’s expand the three Pipeline[0] stages to get a handle on where the most time is being spent in this graph:

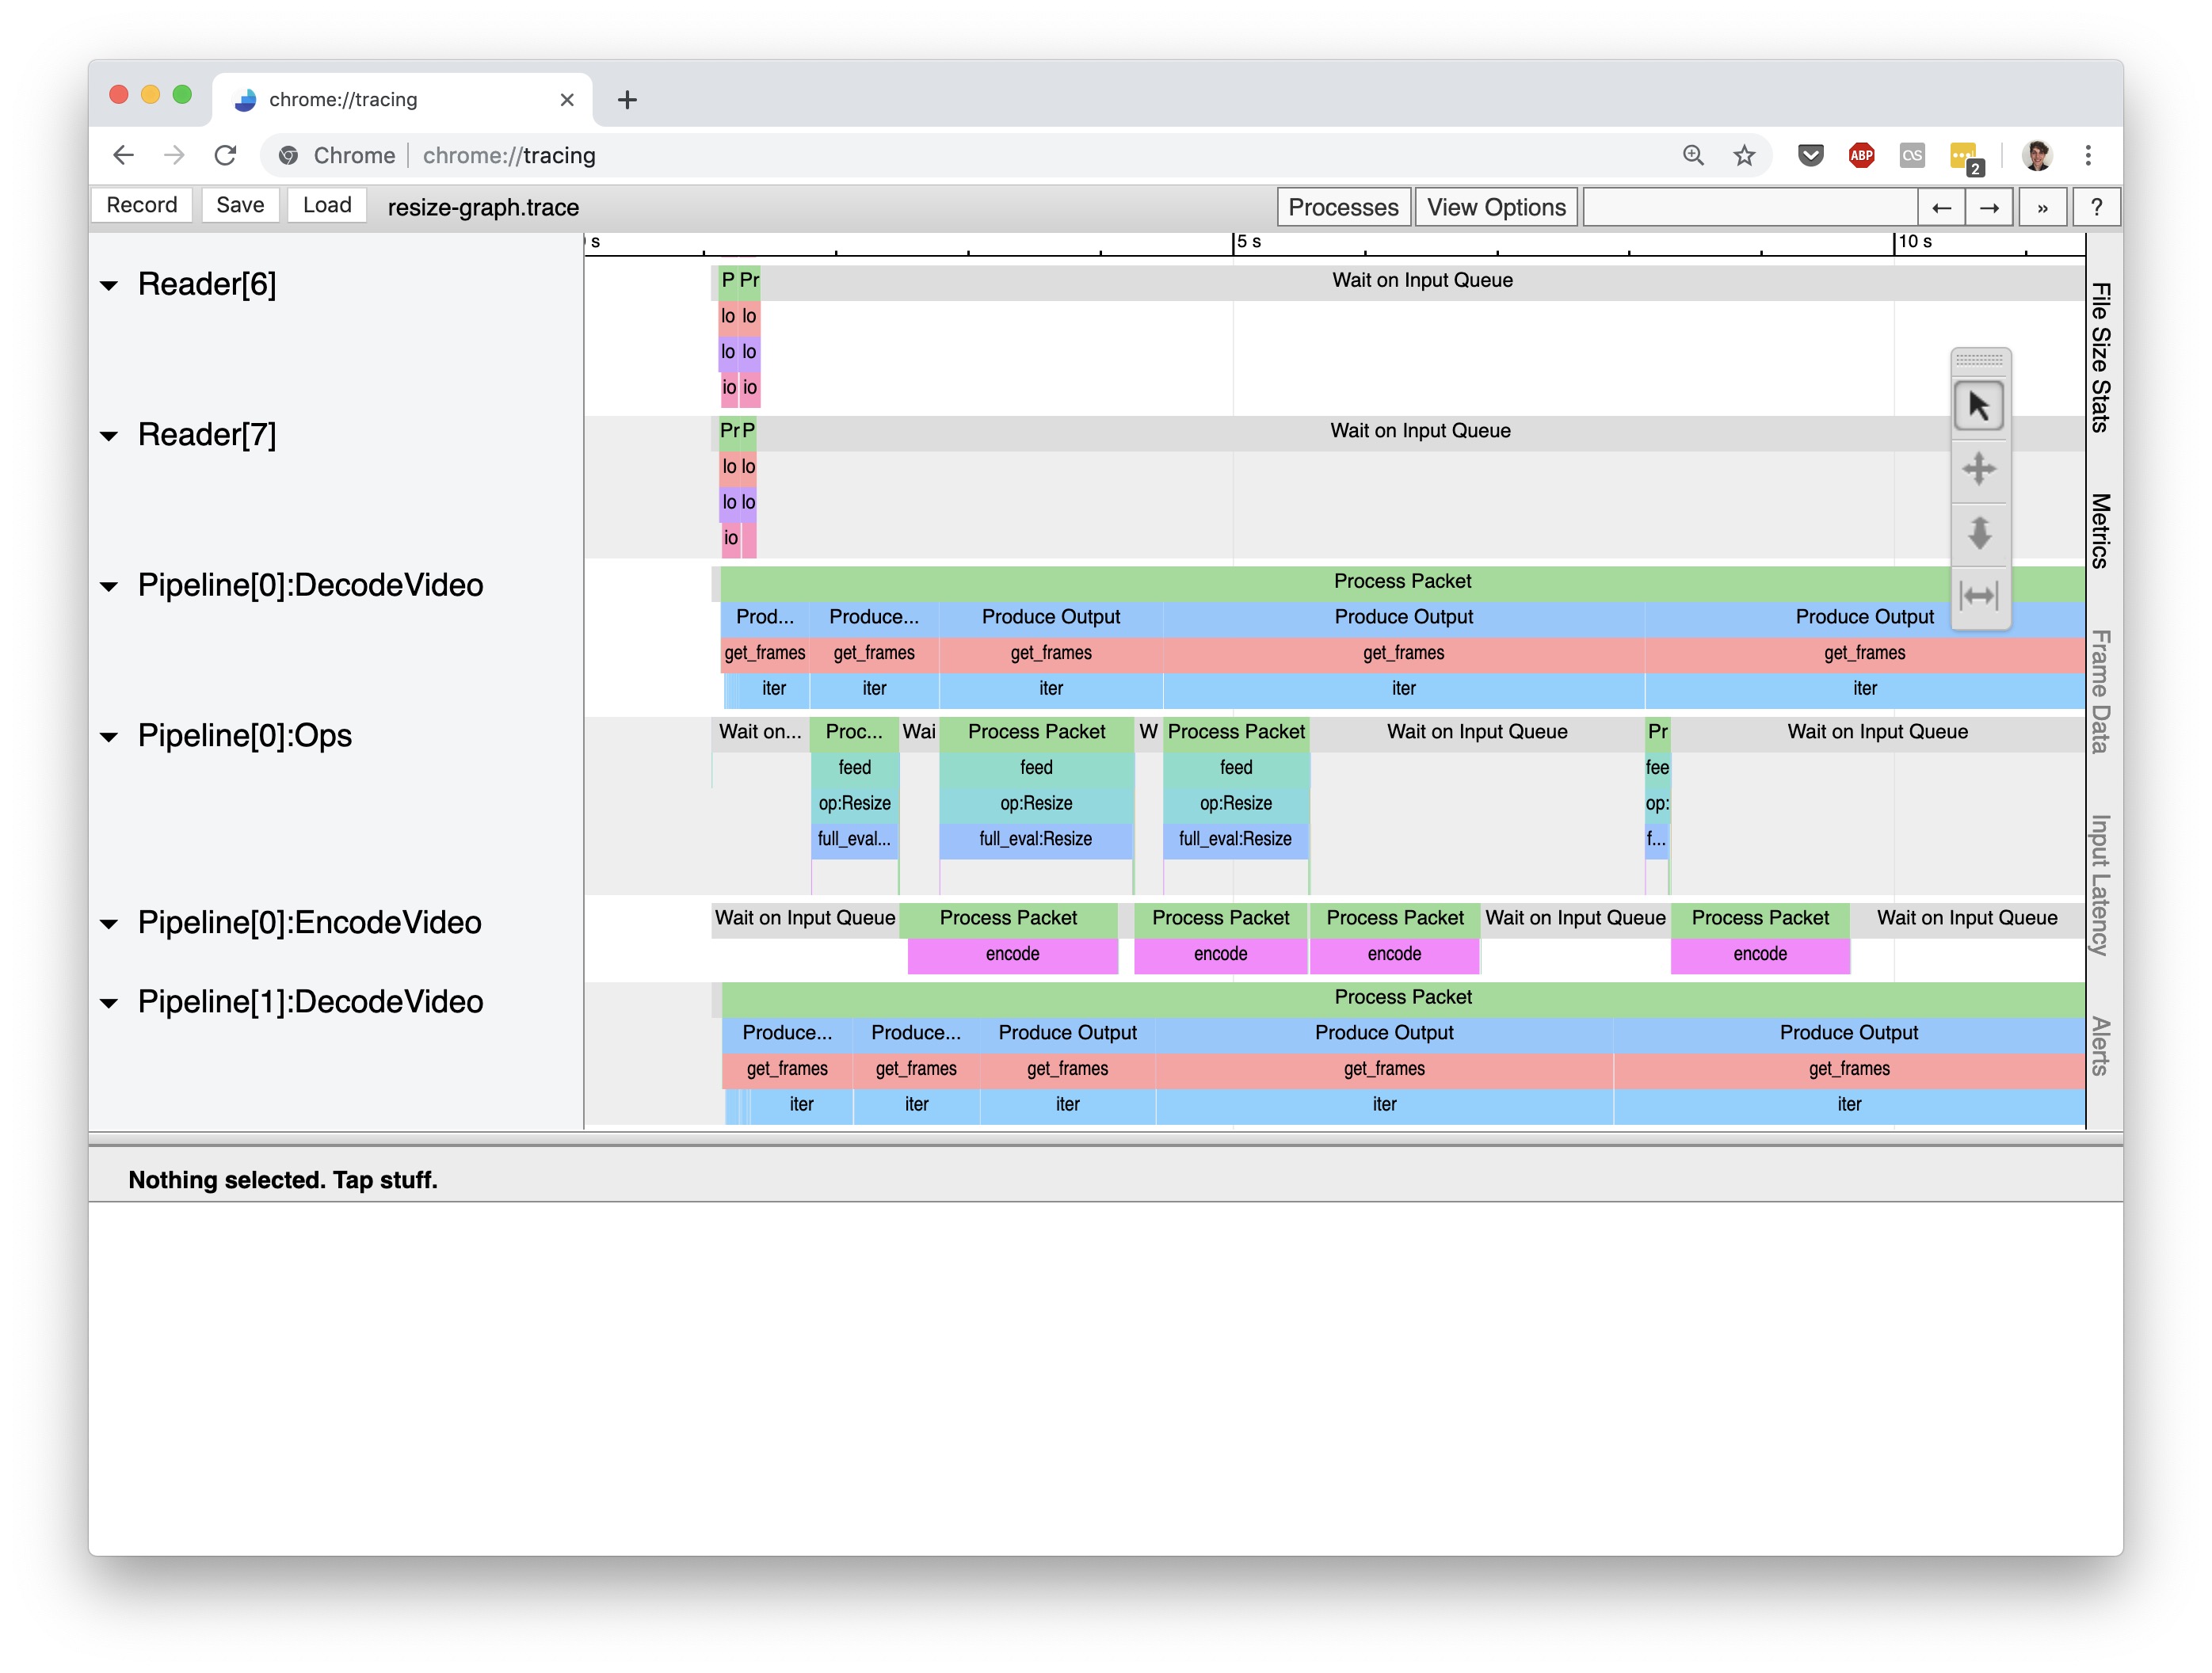
Notice how the timeline for Pipeline[0]:DecodeVideo is constantly occupied by processing events, while Pipeline[0]:Ops[0] has a large amount of idle time (indicated by the gray “Wait on Input Queue” events). This immediately tells us is that this computation graph is decode-bound: the throughput of the computation graph is limited by how fast we can decode frames from the input video.
Tunable Parameters
Scanner provides a collection of tunable parameters that affect the performance of executing a computation graph. Setting these parameters optimally depends on the computational properties of the graph, such as the I/O versus compute balance, usage of GPUs or CPUs, intermediate data element size, size of available memory, and latency to data storage. The tunable parameters are captured in the PerfParams class:
-
class
scannerpy.common.PerfParams(work_packet_size, io_packet_size, cpu_pool=None, gpu_pool=None, pipeline_instances_per_node=None, load_sparsity_threshold=8, queue_size_per_pipeline=4)[source]¶ - Parameters
work_packet_size (
int) – The size of the packets of intermediate elements to pass between operations. This parameter only affects performance and should not affect the output.io_packet_size (
int) – The size of the packets of elements to read and write from Sources and sinks. This parameter only affects performance and should not affect the output. When reading and writing to high latency storage (such as the cloud), it is helpful to increase this value.cpu_pool (
Optional[str]) – A string describing the size of the CPU memory pool to initialize. If none, no memory pool is used.gpu_pool (
Optional[str]) – A string describing the size of the GPU memory pool to initialize. If none, no memory pool is used.pipeline_instances_per_node (
Optional[int]) – The number of concurrent instances of the computation graph to execute. If set to None, it will be automatically inferred based on computation graph and the available machine resources.load_sparsity_threshold (
int) –queue_size_per_pipeline (
int) – The max number of tasks that a worker will request from the master for each pipeline instance. This influences the amount of data that can will be resident in memory at once.
For new users to Scanner, we recommend using the scannerpy.common.PerfParams.estimate() method to have Scanner automatically set these parameters based upon inferred properties of your computation graph. More advanced users that understand how these parameters influence performance can make use of scannerpy.common.PerfParams.manual() to tune the parameters themselves.
